The New Contractor Boom: Where Construction Business Starts Are Surging in 2026

Construction entrepreneurship has been climbing for years, and the map of where it's happening looks nothing like the old industrial heartland. To find out where the next wave of contractors is setting up shop, we analyzed Census business formation data for all 50 states and the largest U.S. metros in 2023, along with national trends on who starts these businesses and whether they last.
The hottest states are in the Mountain West, the densest metros run down Florida's Gulf Coast, and the surge leans more toward solo founders testing an idea than toward firms that will hire a crew. This study looks at where the growth is concentrated and what it means if you're thinking about starting out on your own.
Key Takeaways
- Montana, Idaho, and Wyoming are the top 3 states for new construction businesses per capita.
- Nebraska, Delaware, and Arkansas are the 3 fastest-rising states for new contractors.
- Cape Coral-Fort Myers, Boise, and North Port-Sarasota are the 3 densest major metros for new contractors per capita.
- Interest in starting a construction business is rising faster than the industry itself, with new business applications up 54% since 2019, versus 13% growth in businesses that actually opened.
Where the Contractor Boom Is Biggest
The map of new contractor activity is concentrated in the Mountain West and the Sun Belt, far from the country's traditional construction hubs.
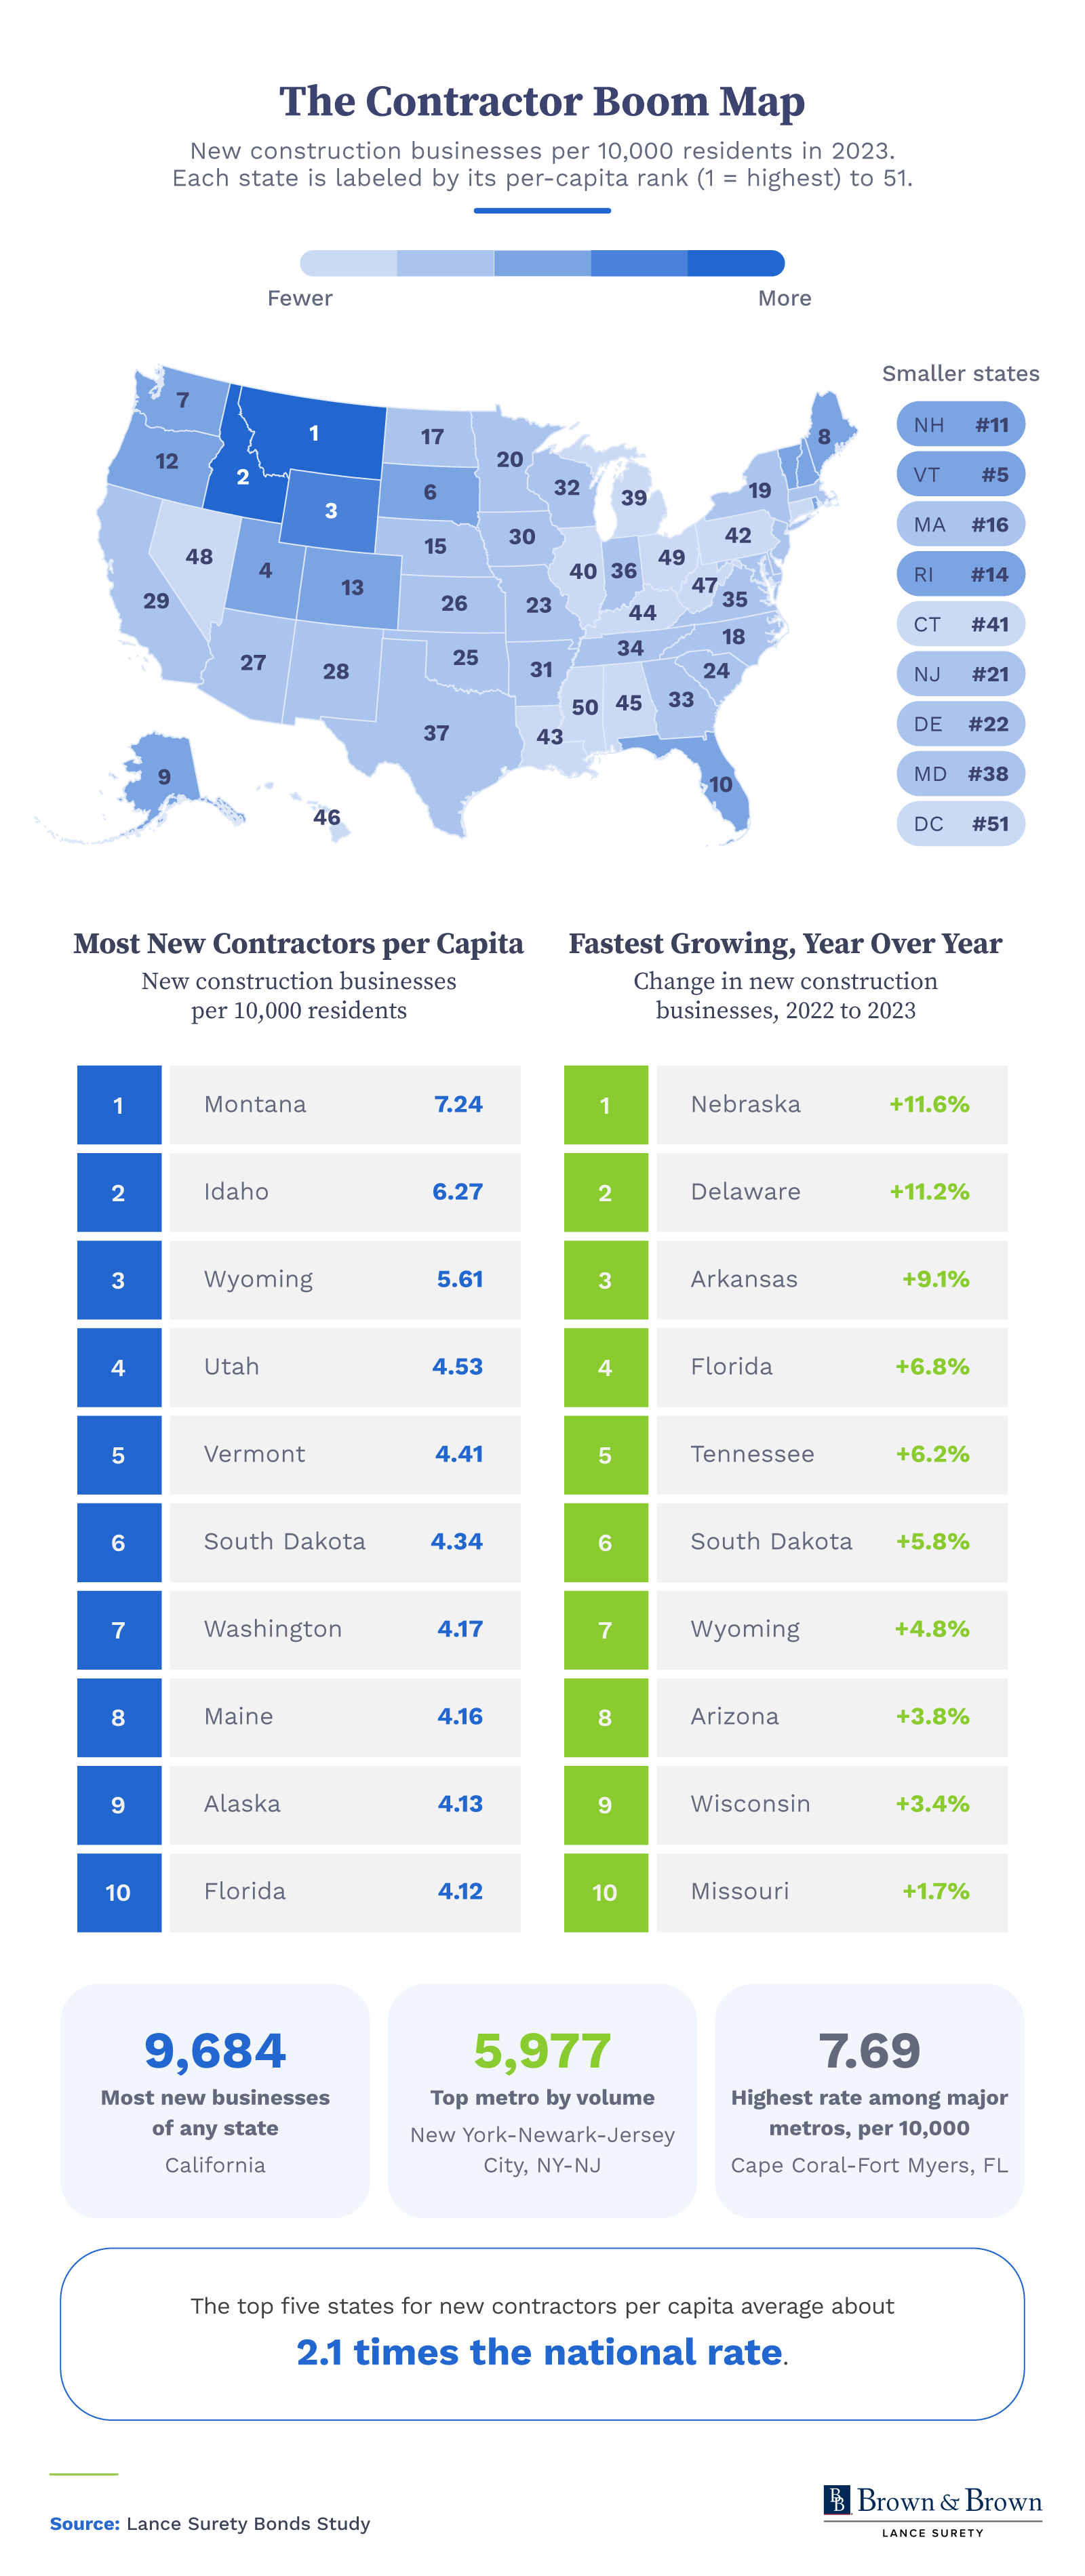
The Mountain West owns the per-capita leaderboard. Montana led every state with 7.24 new construction businesses per 10,000 residents, running nearly three times the national rate, followed by Idaho at 6.27 and Wyoming at 5.61. Add Utah's 4.53, and the region claimed four of the top five spots in the country.
The fastest growth showed up in Nebraska, with new contractor activity up 11.6% year over year, just ahead of Delaware at 11.2% and Arkansas at 9.1%. Cape Coral-Fort Myers, Florida, topped all major metros at 7.69 new construction businesses per 10,000 residents, with Boise, Idaho, and North Port-Sarasota, Florida, close behind. Four of the top five major metros were in Florida.
Raw volume still tracked population, with California (9,684), Florida (9,430), and Texas (6,864) starting the most businesses overall, and New York as the single biggest metro at 5,977. Florida was the only state to land on both boards, ranking 10th per capita and fourth-fastest-growing, making it the top single-state hot spot in the study. The spread between leaders and laggards was wide, too: the top five states averaged about 2.1 times the national rate.
A Boom Built on Applications, Not Open Doors
Look past the headline growth, and the surge starts to look more like intent than activity.
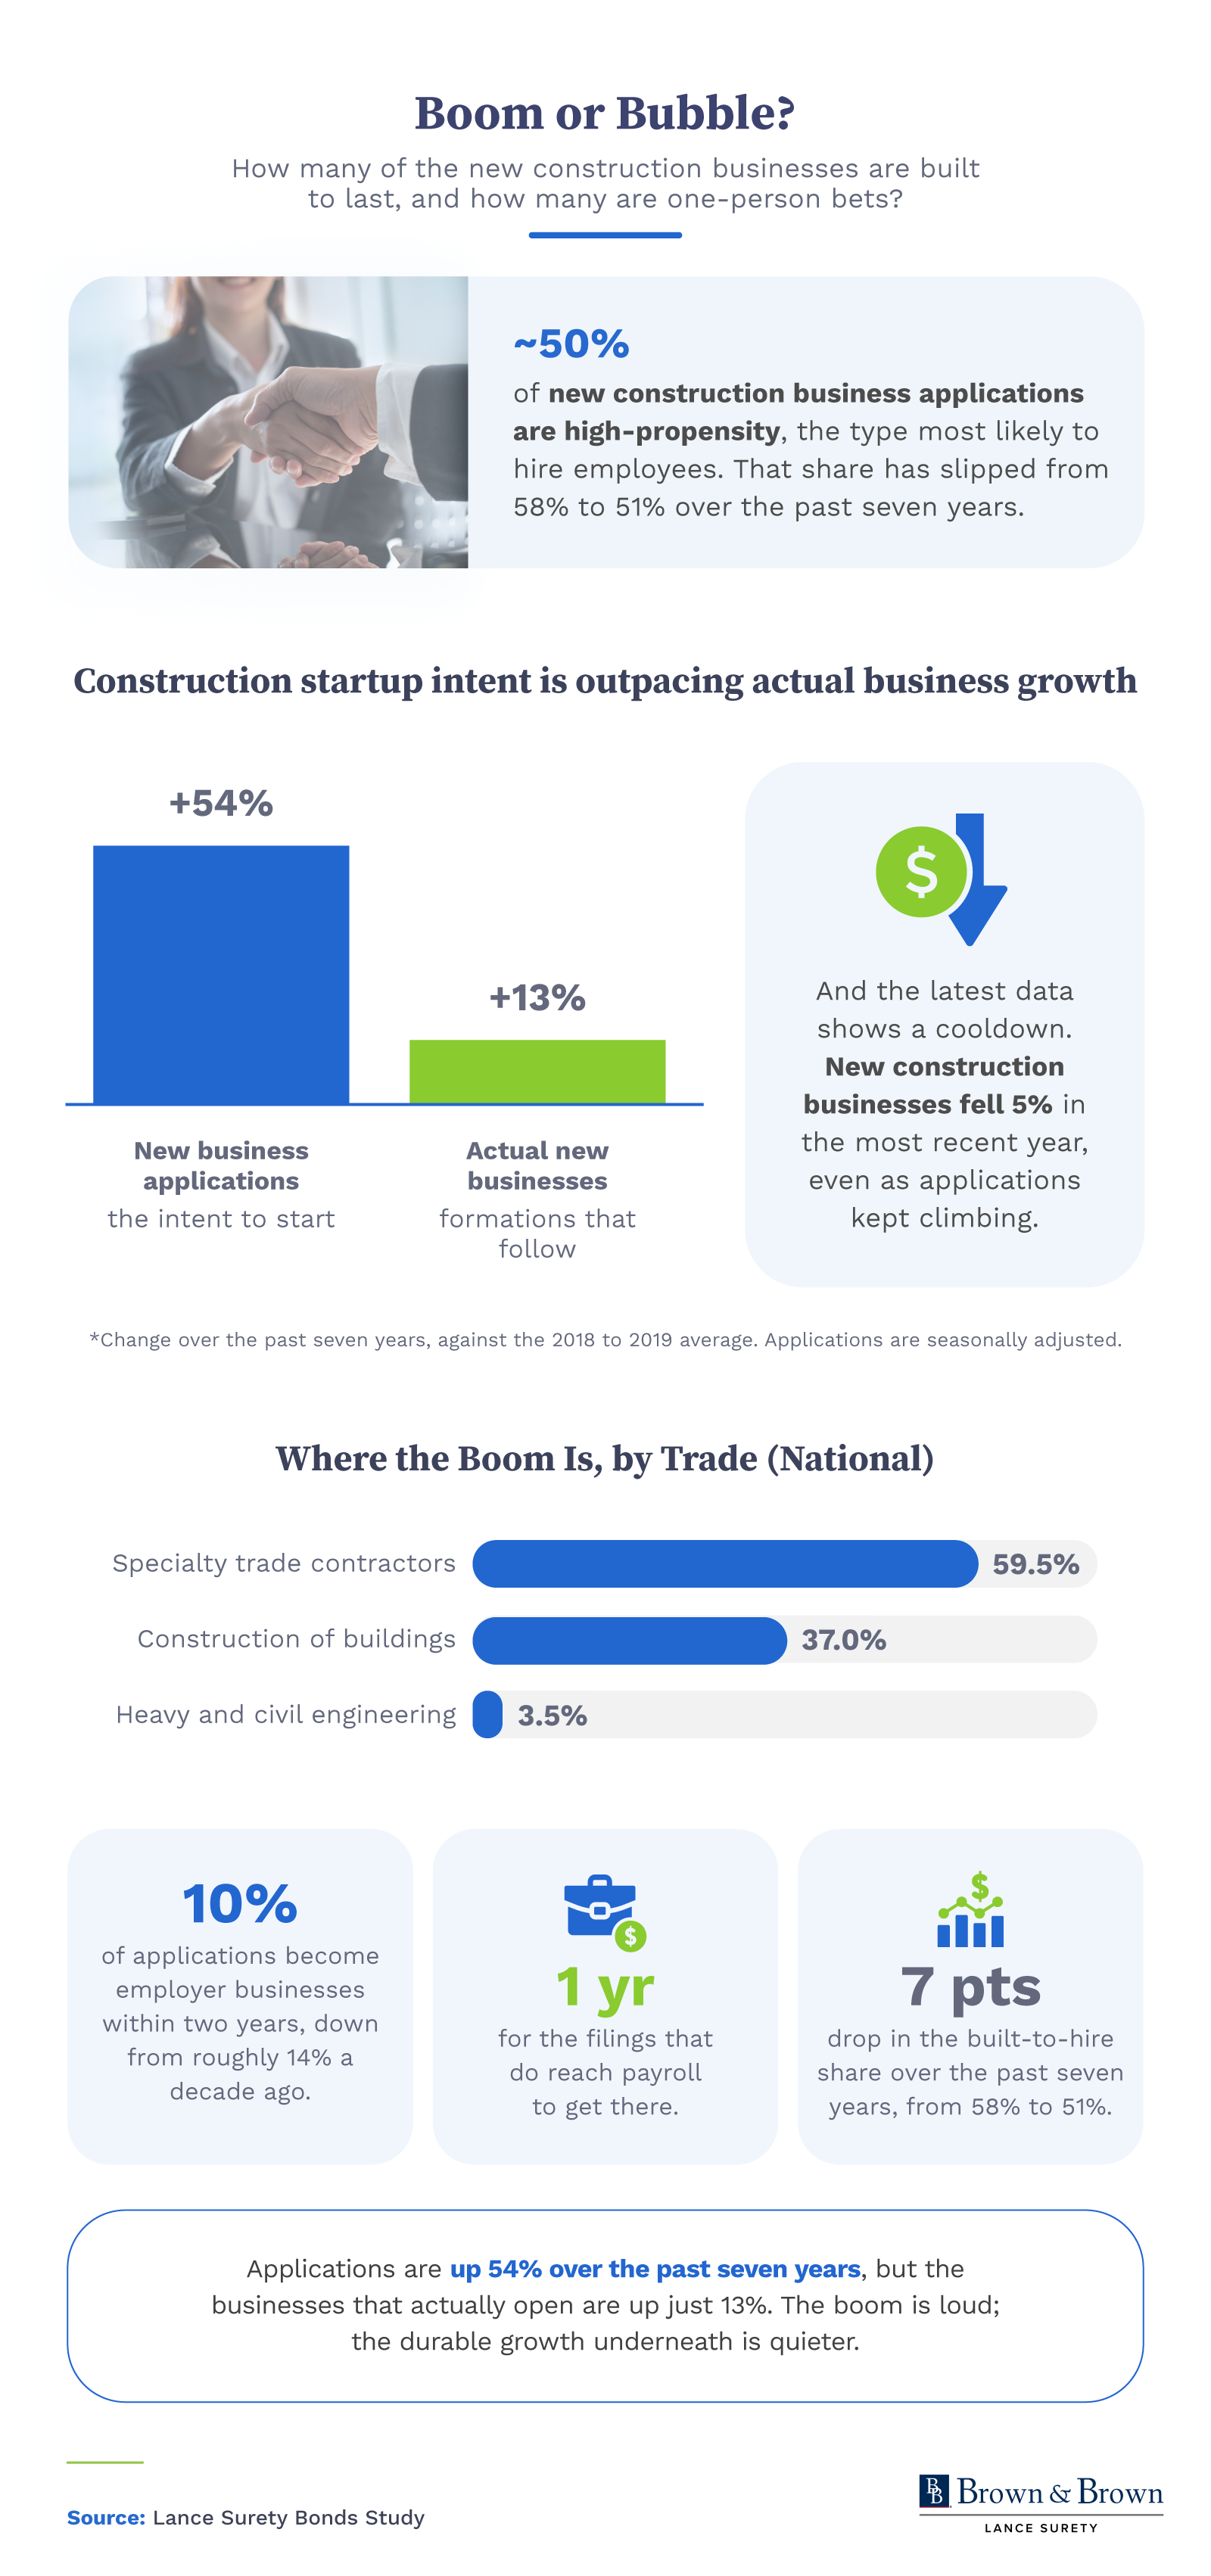
New business applications have outrun actual formations by more than four to one since the pandemic, rising 54% since 2019 against just 13% growth in businesses that opened. The most recent year even cooled, with new construction businesses down 5% in 2023 while applications kept climbing.
The people filing those papers are overwhelmingly specialty tradespeople. Specialty trade contractors made up 3 in 5 (60%) of all new construction businesses, far ahead of general building work (37%) and heavy and civil work (4%). At the same time, the built-to-hire share slipped every year, from 58% in 2018 to 51% in 2025, so a growing slice of filings are solo bets rather than future employers.
Survival to employer status is getting thinner. Just 1 in 10 applications turned into an employer business within two years, down from about 1 in 7 in 2016. Among the filings that do reach payroll, most get there within a year, which suggests the hard part is starting rather than scaling.
Spring Startups and a Trade That Stays Young
The boom also has a rhythm across the calendar and the workforce.
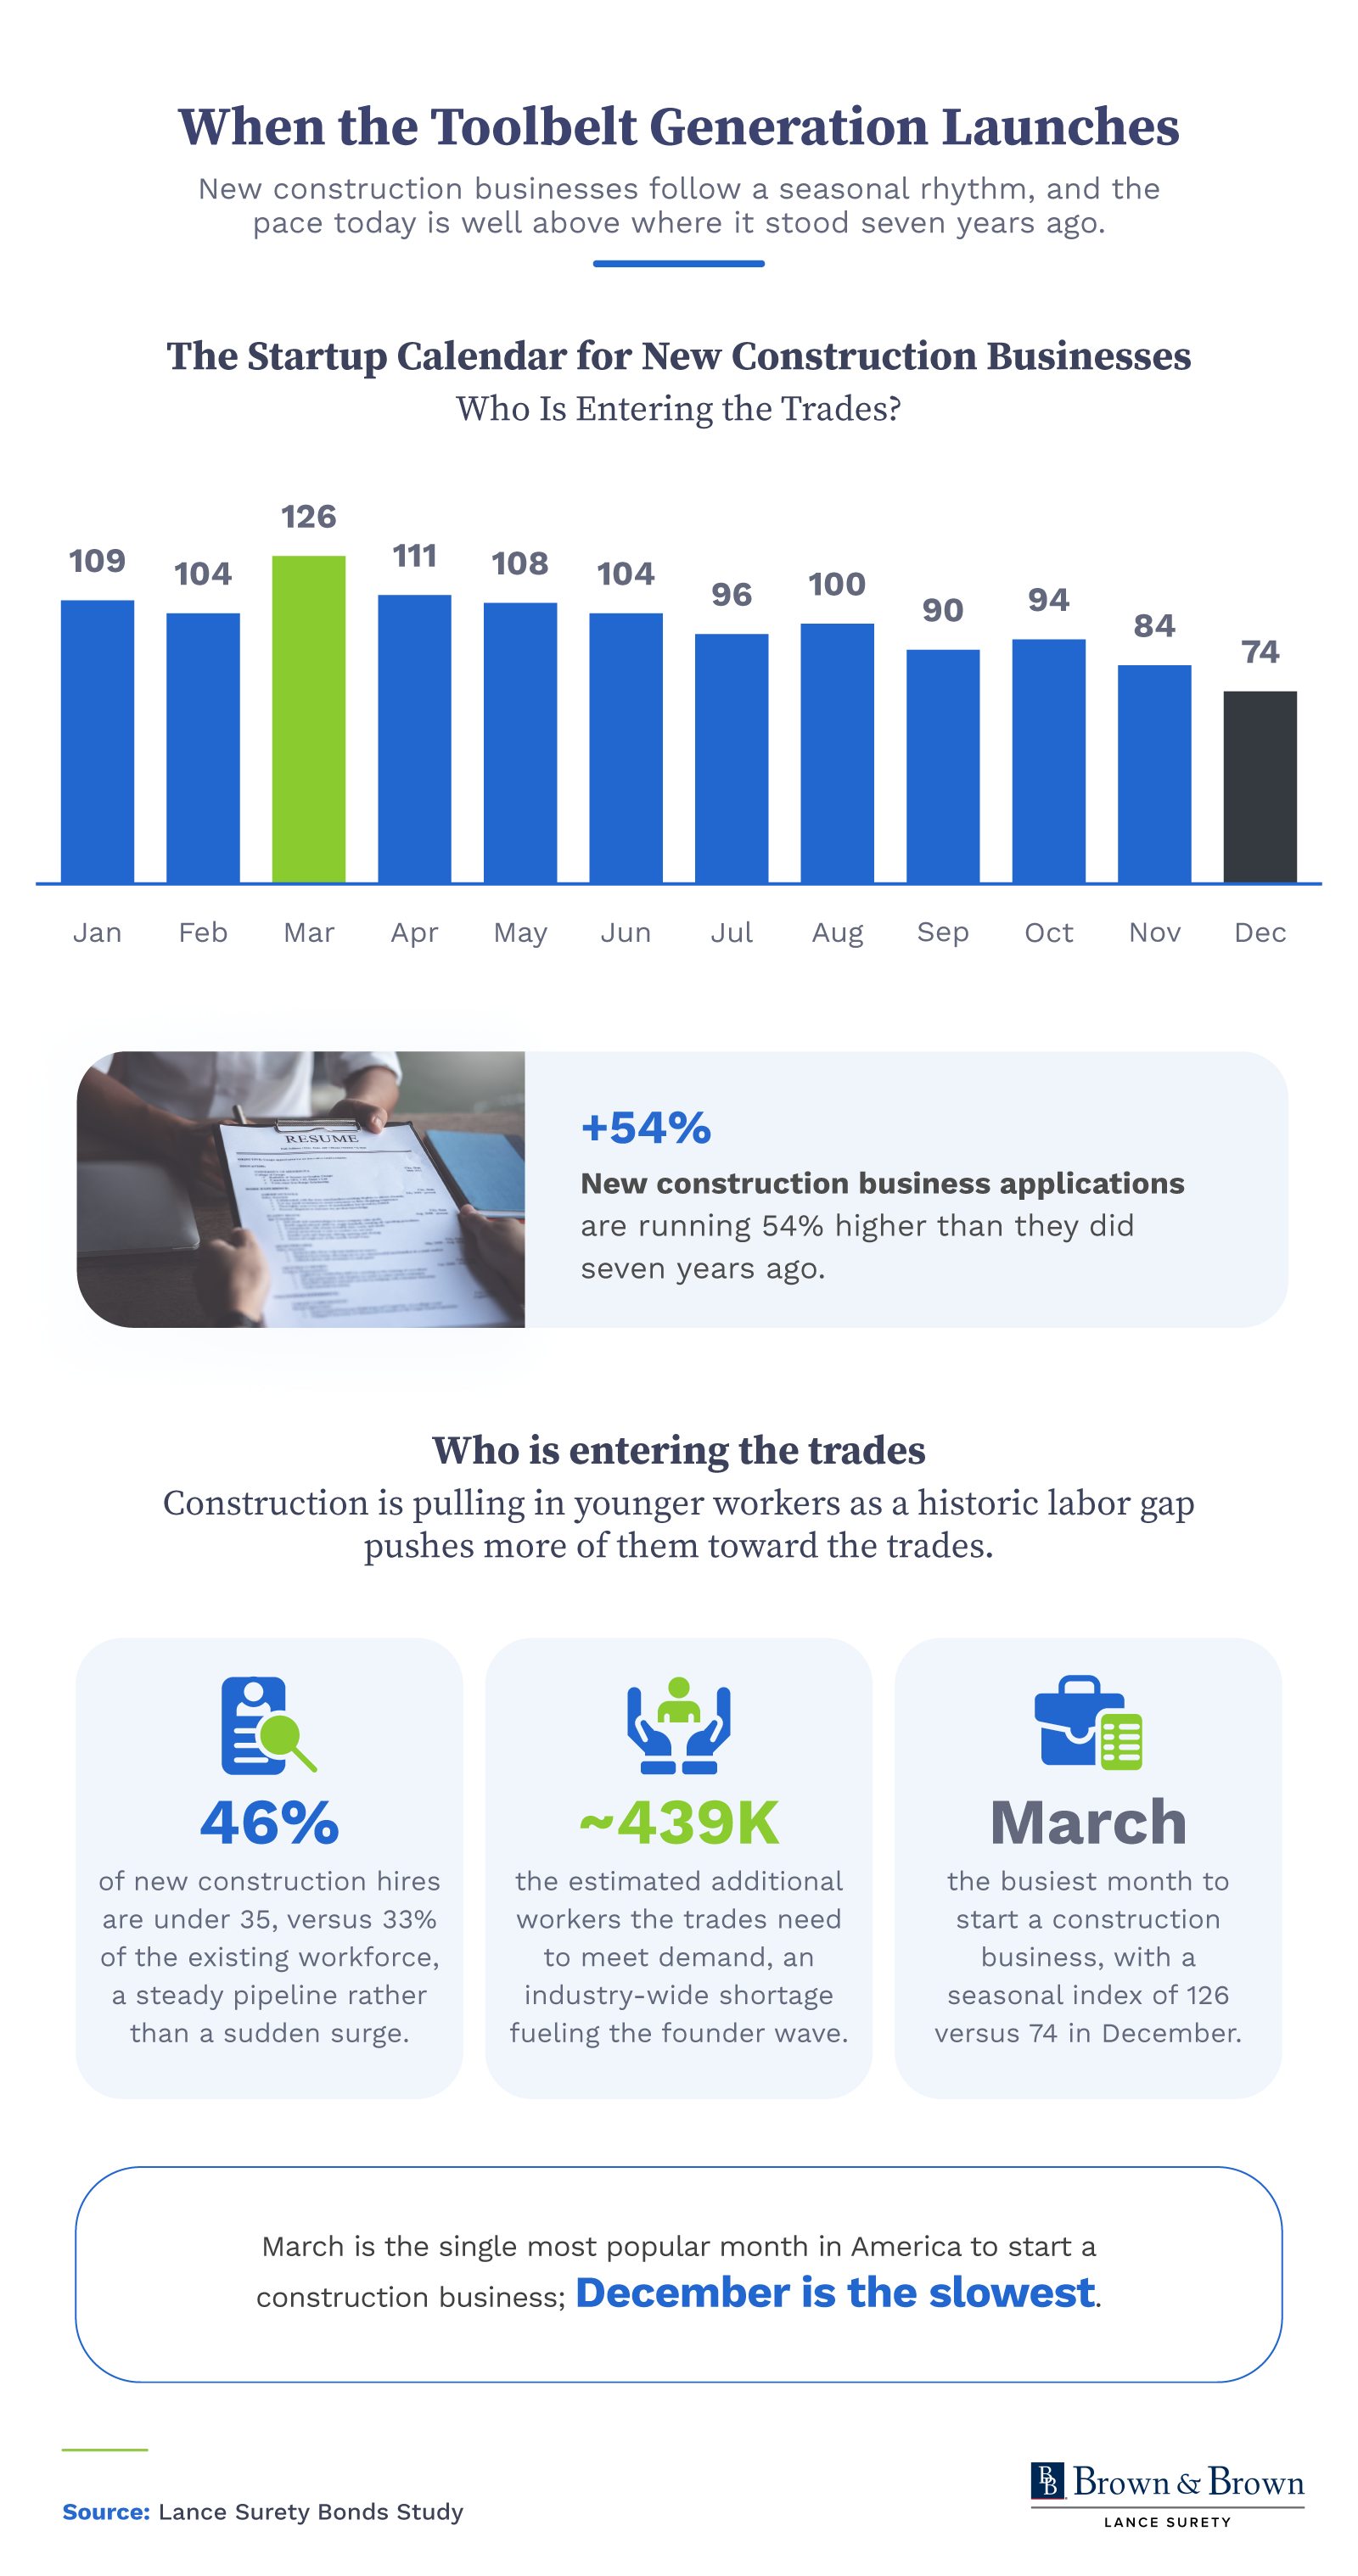
March is the most popular month to start a construction business (about 1.7 times busier than December, the slowest month of the year). The calendar splits down the middle, with the first five months all running busier than average, and September through December all running slower.
New construction work also skews young at the point of entry. Nearly half of new hires (46%) were under 35, compared to 33% of the existing workforce. That youth pipeline has held flat since 2019, so the trade has stayed young rather than gotten younger.
The backdrop to all of this is a labor gap estimated at around 439,000 workers. That shortage could help explain why so many people are moving toward the trades, and why a growing number of them are choosing to start out on their own rather than join an existing crew.
What the Contractor Boom Means
Construction entrepreneurship is climbing, but much of that energy is still intent on paper. It's concentrated among solo specialty tradespeople in the Mountain West and along Florida's coast, and timed to the spring building season. If you're weighing a move into the trades, the opportunity is real and the field is young, but the numbers suggest most of the work begins after the application, getting past that first year and building something that lasts.
Methodology
The New Contractor Boom ranks U.S. states and metros by new construction business formation in 2023, alongside national trend data on who starts these businesses and whether they last. New construction activity is associated with a place; it is not caused by it. Every count is divided by population and expressed per 10,000 residents, so the rankings reflect intensity rather than population size. A second per-capita view divides new businesses by the existing stock of construction establishments to capture entry rate rather than raw scale.
Two geographic rankings draw on the same establishment-birth pool. The most-per-capita ranking covers all 50 states and D.C. by new construction businesses per 10,000 residents. The fastest-growing ranking sorts the same states by year-over-year change, excluding the one place below a 200-births floor in 2020, which removes D.C. Metro rankings cover the 888 metro and micro areas with reported births. The major-metro leaderboard is held to the 110 metros with a population of at least 500,000, so the leaders are recognizable rather than small-county outliers.
The durability and timing measures use the monthly Business Formation Statistics for construction. Momentum compares the latest reading to the 2018-to-2019 average and is reported two ways that are never combined: applications for an EIN, which signal intent to start, and formations, the businesses that actually reach payroll. Built-to-hire is the high-propensity share of applications. Time to payroll is a four-quarter and eight-quarter formation proxy, used because the published duration series is not in the public flat files. The seasonal index is the calendar-month average from 2021 to 2025, with an average month set to 100. The sub-sector split (buildings, heavy and civil, and specialty trades) is national only because it is not published by geography. Percentages not totaling 100% are due to rounding.
Sources include establishment births and entry rates from the Census Bureau's Business Dynamics Statistics (2023), population from the Census Bureau's Population Estimates Program (Vintage 2024), applications and formations from the Census Bureau's Business Formation Statistics (through May 2026), and construction workforce age from the Census Bureau's Quarterly Workforce Indicators (2024 Q4). Geography is classified in NAICS sector 23, 2017 vintage.
Two limitations are worth noting. The statistics measure business applications and employer formations, not survival or revenue, so a high ranking reflects how intensely a place forms new contractors rather than how many succeed. The generational framing is narrative; the workforce-age data describes hires and existing workers rather than founders, and the roughly 439,000-worker trades labor gap is an external industry estimate rather than a figure from this study.
About Lance Surety Bonds
Lance Surety Bonds is a nationwide provider of surety bond solutions for contractors and small businesses across industries. We help new and growing contractors secure the Contractor License Bonds they need to get licensed and start work, with a fast online application and competitive rates. Our team makes it simple for tradespeople to meet state and local bonding requirements so they can spend less time on paperwork and more time on the job.
Fair Use Statement
Found these contractor trends useful? You're welcome to share this report for noncommercial purposes. We just ask that you link back to this page so readers can see the full study and credit Lance Surety Bonds as the source.
Latest posts by Stephanie Martinez (see all)

Get a FREE Surety Bond Quote in Minutes
-
 Fast and Secure Application
 -
 Money Back Guarantee
 -
 Approval in Minutes
 -
 Nationwide Coverage
-
 Fast and Secure Application
 -
 Nationwide Coverage
 -
 Approval in Minutes
 -
 Money Back Guarantee
- Image

- Image

- Image


Lance Surety Bond Associates, Inc. is a surety bond agency based out of southeastern Pennsylvania that is able to write all surety bond types in all 50 states. We are dedicated to servicing all of our customers' surety bonding needs throughout the country and guarantee competitive rates, timely responses, and unparalleled customer service.