Which States Offer the Most Federal Construction Work?

Federal construction spending is creating billions of dollars in opportunity, but those dollars are not landing evenly. To see which states offer the biggest federal construction opportunity, Lance Surety Bonds ranked all 50 states on four measures: total federal construction dollars in fiscal 2025, growth in those dollars between fiscal 2021 and 2024, federal dollars per local contractor, and the share of dollars won by small businesses.
The biggest opportunity isn't always where the most money is for contractors. California, Texas, and Washington receive the most federal construction dollars, but Hawaii, Alaska, and Maryland offer the most per local contractor. For contractors looking for federal work, these rankings offer a starting point for deciding where to focus their search.
Key Takeaways
- Hawaii and Nevada lead the ranking for federal construction opportunities in the U.S.
- Hawaii has about 100 times more federal construction money per local contractor than Minnesota ($654K vs $6.5K). Alaska ($448K) and Maryland ($115K) round out the top three.
- California ($5.86B), Texas ($4.55B), and Washington ($2.99B) receive the most federal construction dollars.
- South Dakota (384%), Montana (310%), and Alabama (292%) are where federal construction spending is growing fastest.
- New Mexico (107%), Rhode Island (94%), and Kansas (86%) are the states where small businesses win the largest share of federal construction dollars.
Which States Have the Most Federal Construction Opportunity?
For contractors considering where to pursue federal work, total spending is only part of the picture. Our ranking also weighs spending growth, dollars per local contractor, and small-business awards to identify states worth a closer look.
Hawaii and Nevada tie for first, and Hawaii stands out for how much federal money it gets per local contractor. It has $654K per contractor, the most in the country, and $2.94B in total federal construction dollars. Minnesota has the least federal money per local contractor. It gets $6.5K per contractor, about 1/100th of Hawaii's.
New Hampshire, Vermont, and Nebraska rank lowest overall. Vermont and New Hampshire have the least federal construction money. They received $26.8M and $60.5M in fiscal year 2025, and their spending fell 52% and 76% from fiscal 2021 to 2024.
Top and Bottom States for Federal Construction Opportunity
A state's overall ranking can help narrow your search, but the individual measures show why it stands out. Here's where federal construction dollars are concentrated, where spending is growing, and where small businesses win the largest share.
Where Federal Construction Spending Is Highest
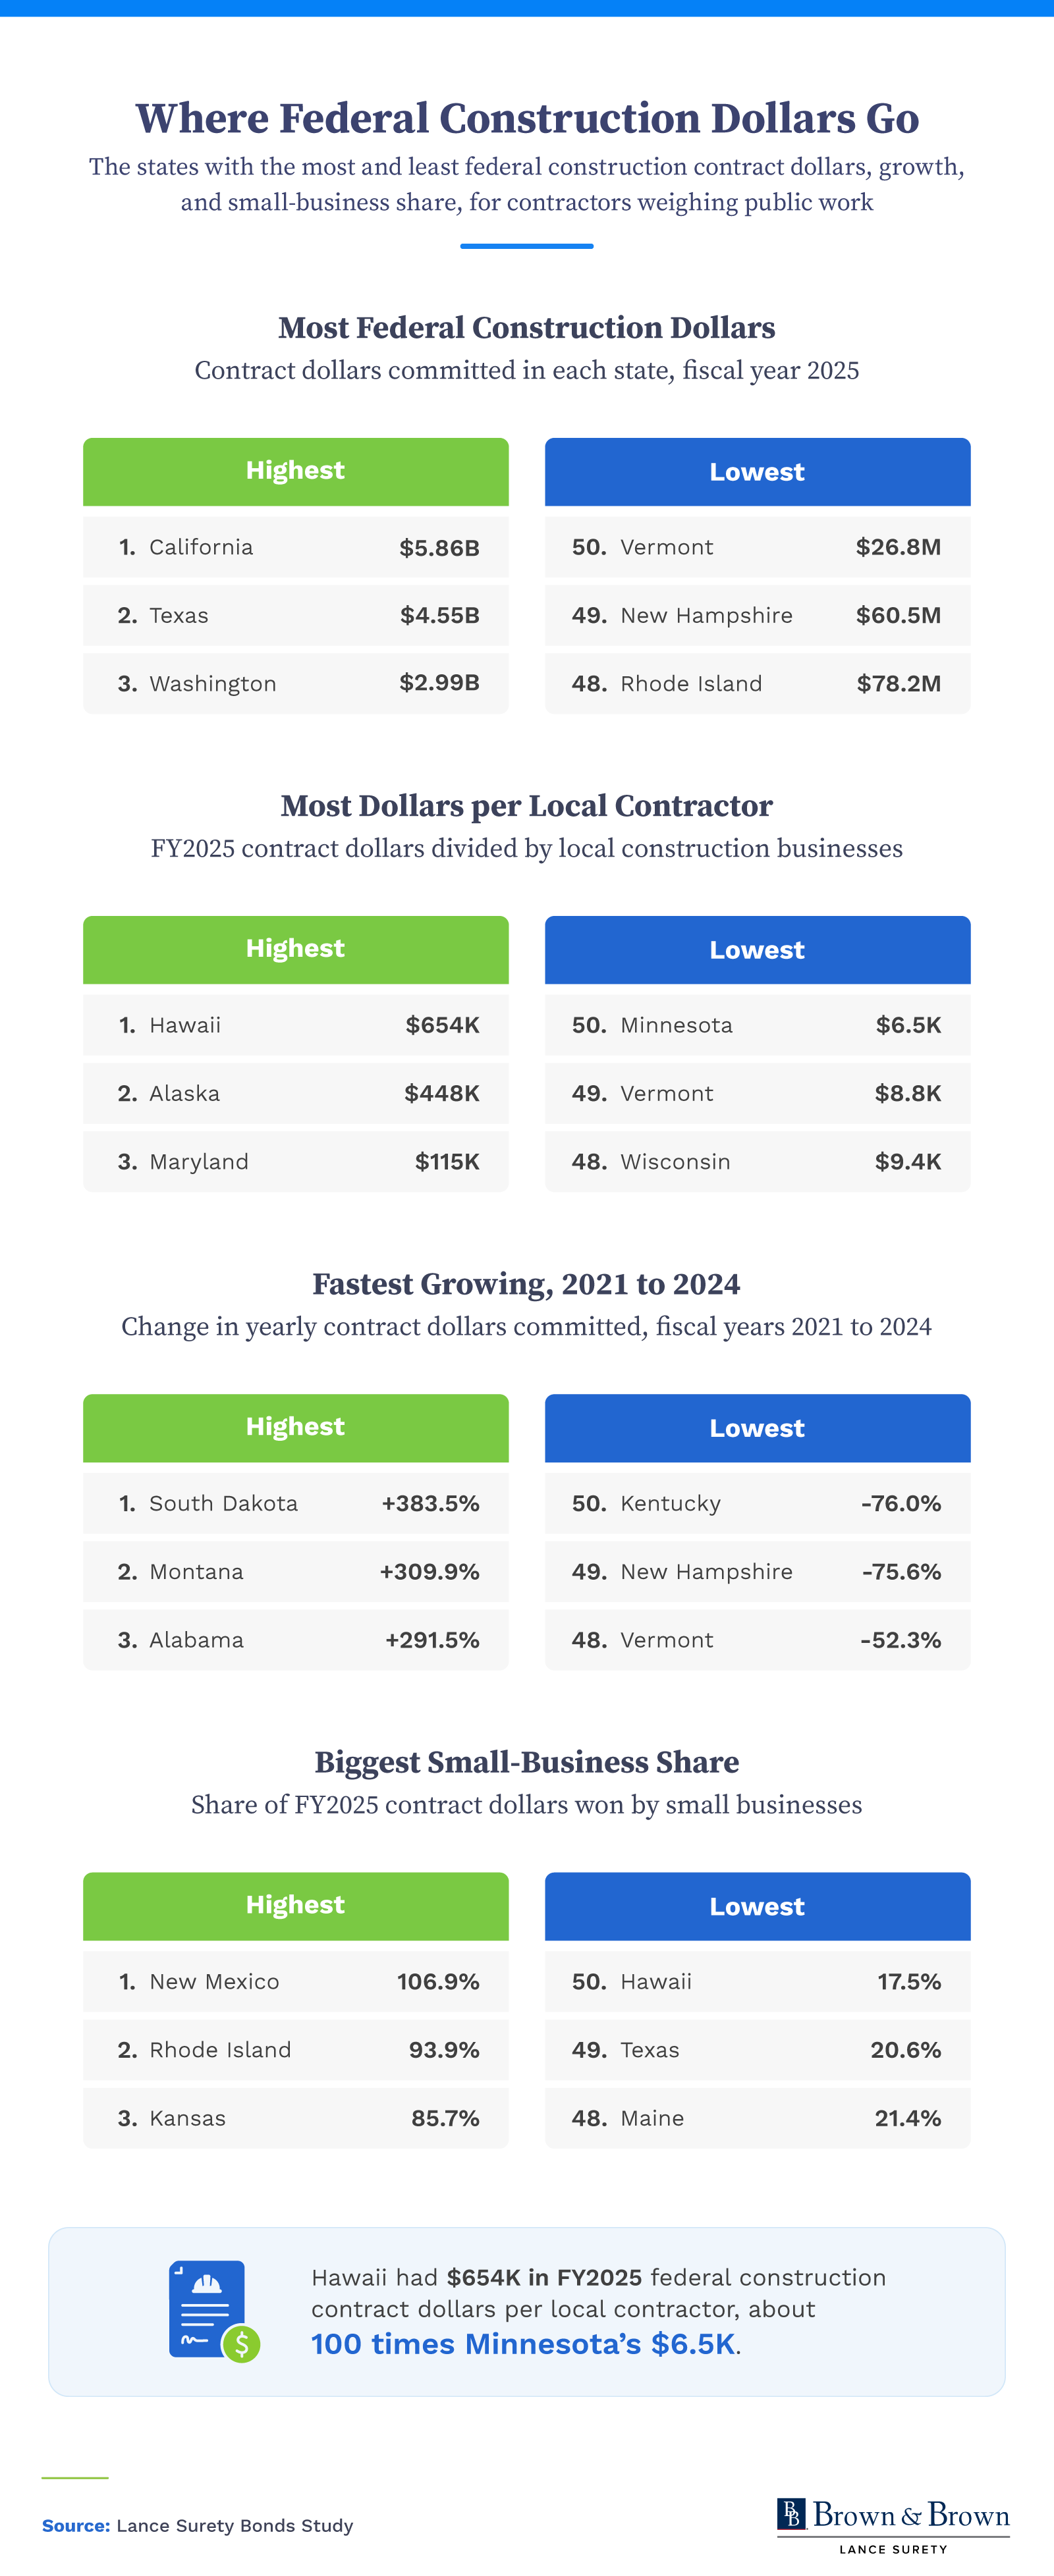
California leads in federal construction dollars at $5.86B, followed by Texas at $4.55B and Washington at $2.99B. At the other end, Vermont has the least at $26.8M, followed by New Hampshire at $60.5M and Rhode Island at $78.2M.
These totals show how much money the federal government committed to construction work in each state in fiscal year 2025. Larger totals indicate more funding overall, but they don't tell contractors how many projects are available or how competitive bidding will be.
Which States Have the Most Dollars per Local Contractor
Hawaii receives the most federal construction dollars per local contractor at $654K, followed by Alaska at $448K and Maryland at $115K. Minnesota ($6.5K), Vermont ($8.8K), and Wisconsin ($9.4K) receive the lowest per-contractor amounts.
This measure divides each state's federal construction dollars by its number of private construction business locations. It helps put spending in context alongside the size of the local industry, but it isn't the amount each contractor actually receives.
Where Spending Is Growing Fastest
From 2021 to 2024, federal construction spending grew fastest in South Dakota (+383.5%), Montana (+309.9%), and Alabama (+291.5%). It fell most in Kentucky (-76.0%), New Hampshire (-75.6%), and Vermont (-52.3%).
South Dakota's increase means spending grew to nearly five times its 2021 level, while Kentucky's decline left it at about one-quarter of its earlier total. These changes show where funding has expanded or contracted, though a large percentage increase can start from a relatively small dollar amount.
Where Small Businesses Win the Largest Share
Small businesses win the biggest share of federal construction dollars in New Mexico (106.9%), Rhode Island (93.9%), and Kansas (85.7%). They win the smallest share in Hawaii (17.5%), Texas (20.6%), and Maine (21.4%).
In Rhode Island, that means small businesses account for nearly 94 cents of every federal construction dollar. New Mexico's figure exceeds 100% because net obligations to all other recipients were negative in FY2025: cancellations and reductions to their awards outweighed new awards. As a result, the state's net total came out below the amount awarded to small businesses.
What the Map Means for Contractors
Federal construction opportunities look different depending on the size and strengths of your business. Use these rankings to identify states worth exploring, then review current projects to see which match your trade, crew capacity, and budget. For smaller firms, the share of funding going to small businesses can add useful context to a state's overall spending. Before preparing a bid, check the project's eligibility, scheduling, and bonding requirements so you can focus your time on work your business is ready to take on.
Methodology
This analysis ranks the 50 states on how much federal construction contract money they receive and how that money is distributed. It uses four measures. Federal contract data comes from USAspending.gov, the U.S. government's public record of contract awards. We counted contracts classified as construction (NAICS code 23), grouped by the state where the work is performed. Local contractor counts come from the Bureau of Labor Statistics' 2025 Quarterly Census of Employment and Wages, which counts private construction establishments (business locations, not companies).
The four measures are:
- FY2025 federal construction dollars: total money committed to construction contracts in fiscal year 2025.
- Growth, FY2021 to FY2024: the percentage change in annual federal construction dollars between those two fiscal years.
- Dollars per local contractor: FY2025 federal construction dollars divided by the number of private construction establishments in the state.
- Small-business won share: the share of FY2025 federal construction dollars won by companies flagged as small businesses.
Dollar figures are money committed in each fiscal year, including later modifications and cancellations on earlier contracts. They are not the full value of each contract. Because cancellations can exceed new awards for other recipients, a small-business share can exceed 100% (New Mexico: 106.9%).
Scoring and weight: Each state is ranked on each measure, with Rank 1 for the highest value. Each rank converts to a Score from 0 to 100. The top state scores 100. The composite Score is the simple average of the four Scores, so each measure carries equal weight (25%).
Limits: Places with small federal totals, such as Vermont, New Hampshire and Rhode Island, can show large percentage swings from small dollar changes. Establishment counts measure business locations, so a contractor with several offices counts more than once. Contractor counts come from BLS and exclude self-employed contractors with no employees. Totals cover the 50 states only, so DC, US territories, and about $2.27M in FY2025 awards with no listed state are excluded.
About Lance Surety
Lance Surety Bonds helps contractors, freight brokers, and other businesses get the bonds they need to get licensed. Whether you need a contractor license bond or another type of surety bond, our team makes the process simple with an online application and guidance along the way, so you can get back to work.
Fair Use Statement
Found these federal construction trends useful? You're welcome to share this report for noncommercial purposes. We just ask that you link back to this page so readers can see the full study and credit Lance Surety Bonds as the source.
Latest posts by Stephanie Martinez (see all)

Get a FREE Surety Bond Quote in Minutes
-
 Fast and Secure Application
-
 Money Back Guarantee
-
 Approval in Minutes
-
 Nationwide Coverage
-
 Fast and Secure Application
-
 Nationwide Coverage
-
 Approval in Minutes
-
 Money Back Guarantee
- Image
- Image

- Image

Lance Surety Bond Associates, Inc. is a surety bond agency based out of southeastern Pennsylvania that is able to write all surety bond types in all 50 states. We are dedicated to servicing all of our customers' surety bonding needs throughout the country and guarantee competitive rates, timely responses, and unparalleled customer service.